
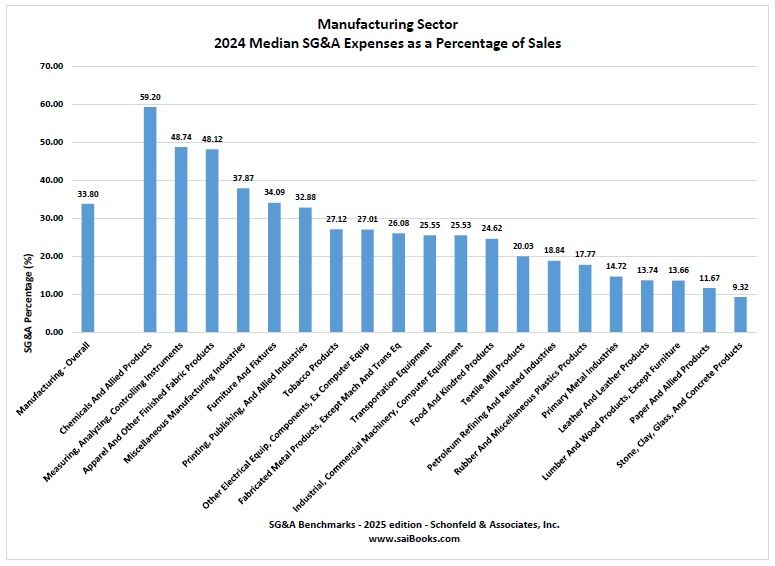
VIRGINIA BEACH, Va. — Schonfeld & Associates, a publisher of business information products for over 40 years, has just released the 2025 edition of SG&A Benchmarks – Manufacturing Sector. This report details SG&A spending information for over 1900 publicly traded companies in twenty manufacturing industries ranging from Food and Kindred Products to Commercial Machinery & Computer Equipment. The report is a convenient source of information for professional managers seeking benchmark information on Selling, General & Administrative spending by major public corporations within the manufacturing sector. Metrics for public companies provide important insight for other firms within the sector. SG&A expenses are all the direct and indirect selling expenses and all general and administrative expenses. SG&A expenses are also called Operating Expenses. Frequently, SG&A to Sales ratios are used to judge efficiency of management spending.
Benchmarks for SG&A spending are hard to find. Averages may be available but are generally too broad to be useful. Within SG&A Benchmarks, the sector summary charts provide side by side comparison of annual median values for each industry within the sector for 2022-2024. To account for SG&A spending practices varying by size of revenues, individual companies are grouped based on fiscal 2024 sales. The detailed tables for each of the individual industries are presented with the companies in three groups as defined by sales of less than $100 million, sales between $100 million and $1 billion, and sales of more than $1 billion. The information presented for each company includes: fiscal 2023 and fiscal 2024 SG&A as a percentage of sales, annual percentage growth rate in SG&A spending and in sales, total sales for fiscal 2024 and headquarters location. Comparing the growth rate of SG&A expenses and sales gives a snapshot of where the profitability of the firm may be heading.
Two sets of industry tabulations are presented for each industry. Alphabetical order by company name aids in locating a firm. Order by SG&A to Sales ratio showcases the ‘leaner and meaner’ firms in each industry.
These reports will benefit anyone seeking competitive benchmark intelligence including corporate staff, financial analysts, investment professionals, lenders, M&A advisors, appraisers and industry consultants.
Visit https://saibooks.com/product/sga-benchmarks-manufacturing/ for more information and to place a secure order for immediate download.

